In part 1 I talked about how we’re using NDepend and NCover to generate highly visual reports for our projects.
These tools look great, but are of limited use without being able to analyse how changes to the code have affected the metrics. In this article I want to talk about a couple of ways we can use tools like NDepend, NCover and TeamCity to generate other visual reports to support our dashboards.
NDepend
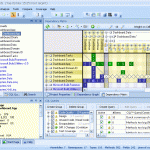
VisualNDepend is a fantastic tool, but takes time to learn how to use and it often requires considerable digging around to find what you’re looking for. A more immediate and visual tool is the NDepend report (example) which can be generated through VisualNDepend or via the NDependConsole. It contains a nice summary of things such as assembly metrics and CQL queries such as methods with more than 10 lines of code. Importantly here, TeamCity can generate and display NDepend reports using NDependConsole as Laurent Kempé explains here (using MSBuild though it’s just as possible with NAnt or Rake).
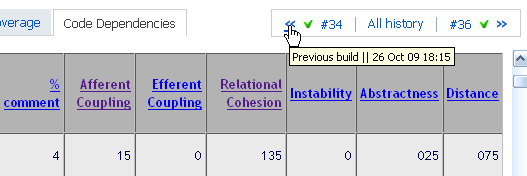
However I find even this report contains too much information so we’ve modified the NDepend configuration file to show only four of the sections (see example) Assemblies Metrics, Assemblies Abstractness vs. Instability, Assemblies Dependencies Diagram and CQL Queries and Constraints. It’s now much easier to read. For example, we can see the assemby metrics at the top show us some of the same metrics used in the dashboards but broken down by each assembly. When this is integrated into TeamCity you merely need to click back to see how any of them have changed since previous builds.
We can also see the method “WriteChange(…)” clearly needs some love being the top method to refactor. When you compare the two reports side by side it’s easy to see how, just like methods or classes with too many lines of code, too much information can make what are otherwise valuable reports unreadable. I have to admit it took me a long time to get into using NDepend well and a lot of that is down to the overwhelming amount of information it produces.
NCover
It’s no good finding out your test coverage has gone down if you don’t know why. You could pay for an NCover licence for each developer, but less costly is to integrate the NCover report into TeamCity. Again, Laurent Kempé explains how to do this here and here is an example of the NCover report for our Dasbhoards project. It doesn’t provide the same amount of detail as the NCover GUI, but will at least give you a good head start in the right direction.
So, in the end we have three tabs in our TeamCity project builds which, when used in conjuction with each other, give us a highly visual representation of how modifications are affecting the maintainability of our code. Of course there are many other reasons why code could be problematic but the context these these tools open up make it much easier for developers to learn and understand and therefore be able care more about the maintanability of their projects and the consequences of writing bad code.


